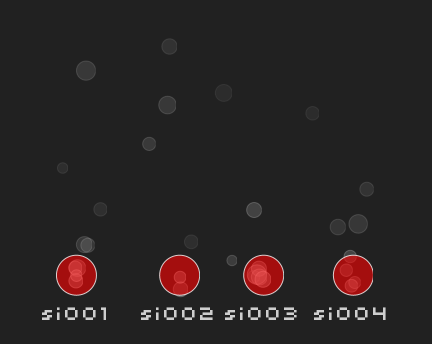
Just thought I might share this one. It's a sneak preview on a late idea of mine: Visualizing Nagios/Icinga host- and service-states by showing them as floating bubbles.
If a critical state occurs a new bubble (like the red ones above) is created and it will float to the top of the screen with it's velocity depending on the severity of the problem. It will then float there until the problem has been dealt with and the state returns to normal.
I'm currently implementing it using the Processing library and the Eclipse IDE (I don't like the one shipped with Processing).
The code I've written so far can be checked out at my Subversion repository:
Add a comment
